There was a flurry of interest in adolescent drinking last week after a new report from the Health Behaviour in School-aged Children (HBSC) study found English children are now the most likely to drink alcohol across the 44 high-income nations studied.
This reflected large increases in alcohol consumption among school children between 2018 and 2022, with the exception of 15 year-old boys.
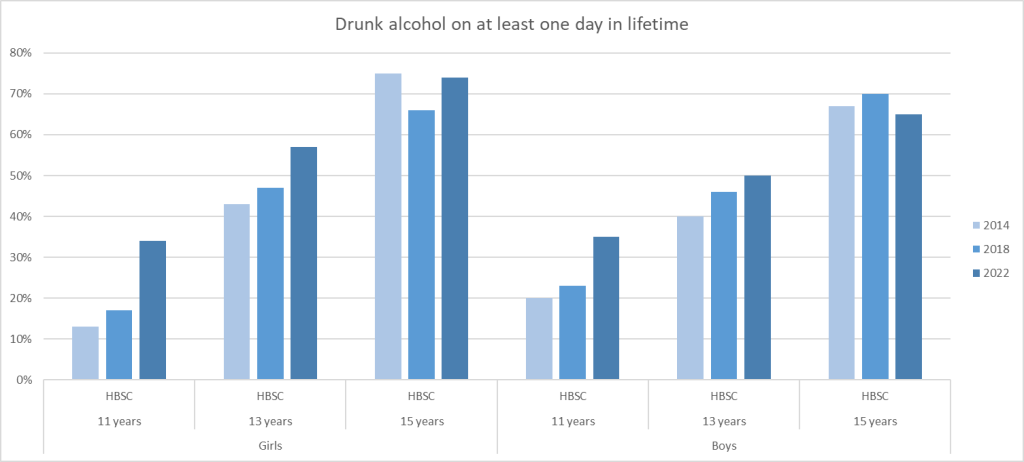
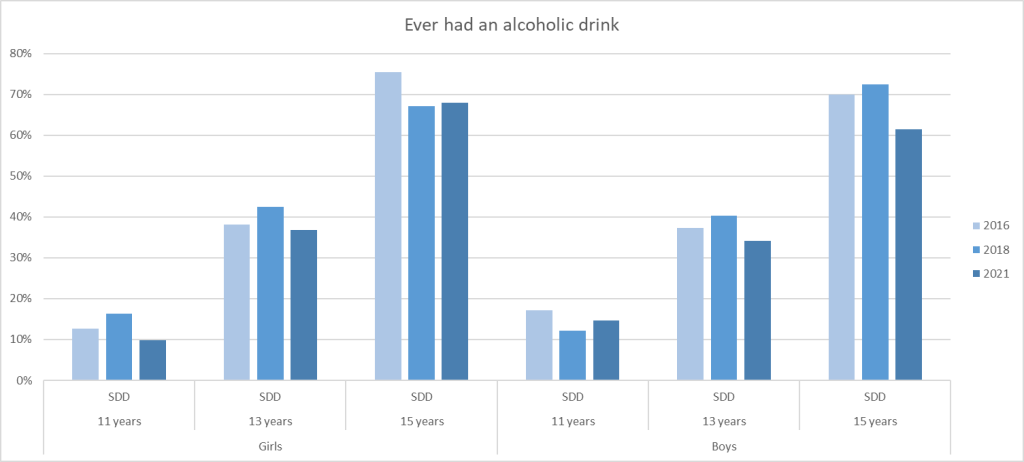
These figures were striking because they differ starkly from previous evidence. The HBSC study is a reputable survey backed by WHO, but the UK Government's own authoritative survey of drinking, smoking and drug use among schoolchildren (SDD) reports more positive trends.
The 2021 SDD survey shows declines in drinking on most measures for most age groups.
So what is going on here? Is alcohol consumption rising or falling among schoolchildren and which study should we believe? I'll start with some methods points…but there are numbers coming as well.
Let's get the obvious question out of the way first. Both surveys were carried out after the COVID-19 lockdowns had ended. The SDD collected its data from September 2021 to February 2022 (although most of the data was collected in 2022) and the HBSC did so from March to July 2022.
These are school-based surveys that are completed in classrooms, so the pandemic did make it difficult to recruit schools who were struggling to get back up and running, but this does not appear to have affected the studies in different ways.
The response rate for schools was poor, with only around one in ten of those selected agreeing to participate in the HSBC study. This reflects a long-term decline in willingness to participate, with the SDD reporting response rates for schools falling gradually from the 1980s onwards.
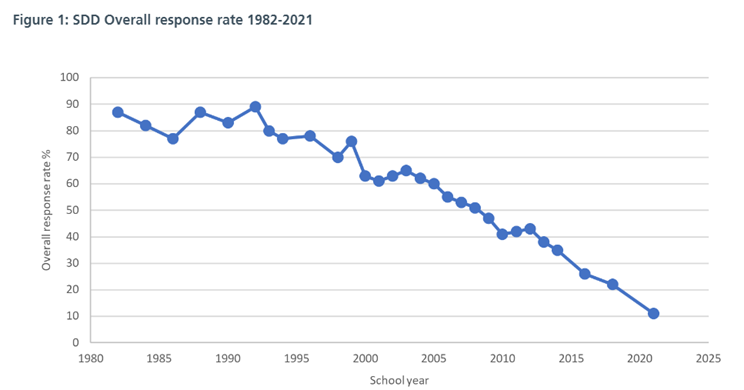
The SDD response rate for schools of 12% in 2021 is therefore a large drop, but not as alarming as it might appear. The HBSC England report suggests only 37 out of 400 schools selected for participation actually did so, implying a similarly low response rate of 9%.
Once schools agree to participate, the studies take a slightly different approach to sampling students. The SDD typically randomly samples three classes within each school, one from Years 7 and 8 and two from Years 9, 10 and 11.
In contrast, HBSC typically surveys all students in Years 7, 9 and 11 within each school, reflecting it's aim to achieve a sample comprising three groups with a mean age of 11.5, 13.5 and 15.5 respectively.
In practice, this means HBSC's sample, which is already substantially smaller than SDD's is concentrated in a smaller number of schools. This makes it much more vulnerable to sampling biases at the school level.
There are some other differences between the surveys in measures and how they treat age groups. But these should largely affect comparisons of rates in a single year year and not comparisons of trends over time. So I'll ignore those differences for now.
The data itself shows the sheer incompatibility of findings from the two studies. Look at the different size and direction of trends for 'ever drinking' and 'drinking in the last month'. I've compared with both the most recent and next most recent here surveys here.
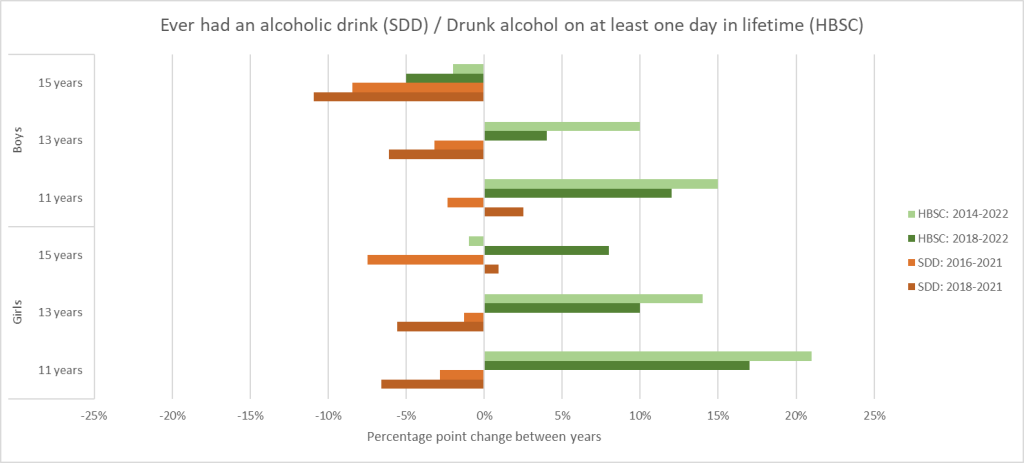
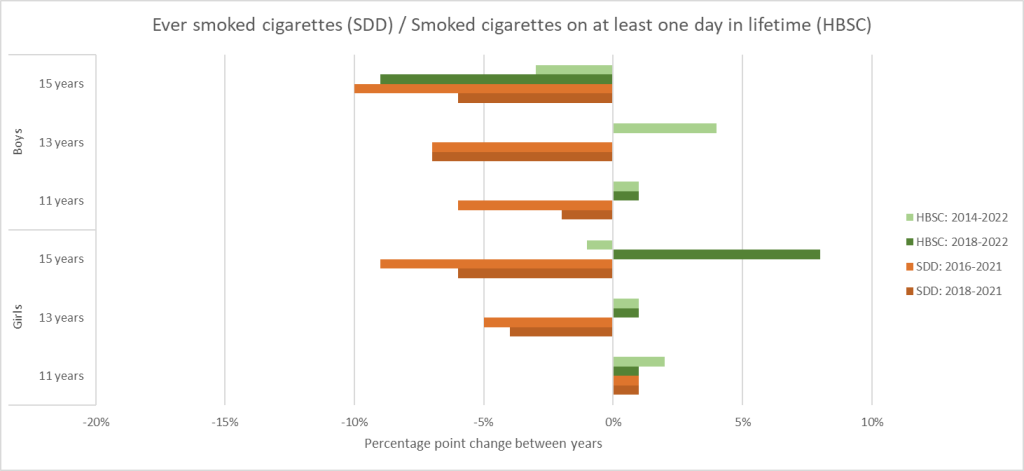
This isn't just an alcohol problem. We see the same kind of thing, if slightly less dramatic, when we compare for ever having smoked. Sadly ever using cannabis isn't available in the English HBSC for 2022. So we can't compare that.
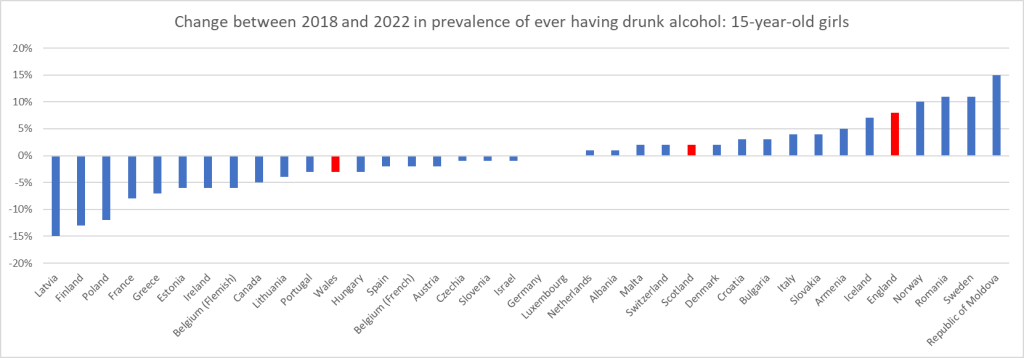
The HBSC has a standard international protocol but every country runs its own study separately. So are the trends consistent across countries? It depends what you look at. For 15-year-old boys, we see a pretty consistent decline in drinking. For 15-year-old girls, no so much.
Closer to home, we can compare trends for England, Scotland and Wales, who all collect HBSC data as full-size separate studies. Again, the trends are… perplexing.
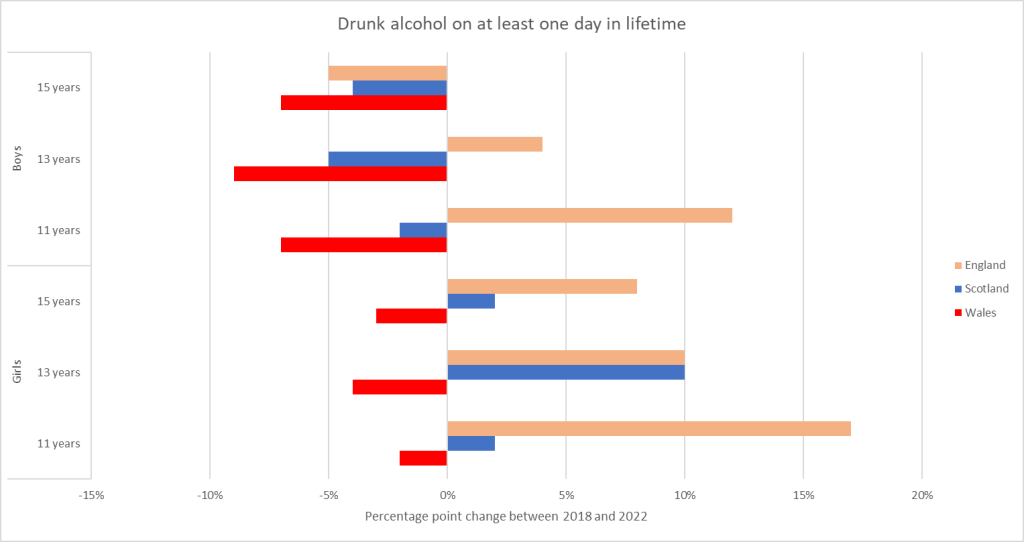
You can read that last graph through a COVID experiences lens, minimum unit pricing lens or various other lenses, but I'm not sure any offers a convincing explanation.
The overall picture is the trends from the SDD and the HBSC cannot both be right. They are simply too far apart. At this point, it's not clear what is driving those differences. Until we know, we should be cautious about drawing strong conclusions.
We do know there has been a long-term decline in youth drinking and there's little wider evidence that is changing. There's little evidence of rising harm in school children (if anything it's the opposite) and I'm not aware of any qualitative studies suggesting increased drinking. That said, we should not dismiss the possibility that adolescents are drinking more. We certainly know some adults did so over the pandemic, leading to a sharp rise in alcohol deaths. It's certainly possible that the drivers of that also affected adolescents.
So the jury remains out until more evidence is available. A further wave of SDD data is due later this year. Until then the big message of this blog post is that we should withhold judgement on what is happening with youth drinking.
Credits
All graphs taken from:
Charrier, Lorena, van Dorsselaer, Saskia, Canale, Natale, Baska, Tibor, Kilibarda, Biljana. et al. (2024). A focus on adolescent substance use in Europe, central Asia and Canada. Health Behaviour in School-aged Children international report from the 2021/2022 survey. Volume 3. World Health Organization. Regional Office for Europe. https://iris.who.int/handle/10665/376573. License: CC BY-NC-SA 3.0 IGO

