
The previous UK Government's green paper, 'Advancing our health: prevention in the 2020s', committed to working with alcohol producers and retailers to encourage people who drink above low-risk levels (those who drink no more than 14 units of alcohol per week, spread over three or more days) to switch to alcohol-free and low-alcohol (no/lo) alternatives, and to significantly increase the availability of these drinks by 2025. In the absence of a new prevention strategy, this remains a significant part of the current government's alcohol policy.
To see how well these plans are working we conducted a study exploring trends in the alcohol-free and low-alcohol drinks market in the UK. This was recently published as 'Current and future trends in the consumption, sale and purchasing of alcohol-free and low-alcohol products in Great Britain, 2014 to 2023' in the journal Addiction. We aimed to:
- characterise trends for no/lo sales, purchasing and consumption in Great Britain between 2014 and 2023
- forecast future trends to the end of 2025 to inform target-setting for the end-date of the current UK Government policy
This research was conducted as part of the NIHR-funded No/Lo Project, which is investigating whether alcohol-free and low-alcohol drinks are improving people's health.
Seven key indicators
We worked with the UK Department of Health and Social Care to choose seven indicators that would best inform their policy development and monitoring:
- No/lo sales compared to total alcohol sales in pubs, bars, and restaurants (on-trade)
- No/lo sales compared to total alcohol sales in shops and supermarkets (off-trade)
- The number of pubs, bars, and restaurants offering no/lo beer on tap
- The number of households that don't normally buy alcohol but are buying no/lo drinks (off-trade only)
- The number of households that are drinking at increasing or higher-risk levels* and are buying more no/lo drinks (off-trade only)
- The number of households buying more no/lo drinks and fewer alcoholic drinks
- The number of hazardous or harmful drinkers who are trying to cut down on alcohol and have used no/lo drinks in their most recent attempt
* Increasing or higher risk households are those that purchased more than 14 units of alcohol per adult in the household per week on average over the previous 12 months.
How the study was done
To explore the seven indicators fully we used data from a range of sources:
- Weekly on-trade alcohol sales data from CGA by NielsenIQ
- Weekly off-trade alcohol sales data from Circana
- Household panel study data on off-trade alcohol and no/lo purchases from Kantar's Wordpanel
- Individual-level data on standard alcohol consumption from the Alcohol Toolkit Study
We then analysed this data over time to identify trends and predict future values, using a statistical method called time series analysis. This involved a detailed analysis using SARIMA (seasonal autoregressive integrated moving average) time series models, which comprised three steps:
- first, we created a SARIMA model based on the data;
- second we used it to forecast values up to 2025;
- and third, we calculated prediction intervals and validated the forecasts – these intervals provide a range within which the actual future values are likely to be, helping us understand the reliability of our forecasts.
What the study found
These results provide a brief overview of the study's findings. Further details, including the findings from all seven indicators, can be found in the full research paper.
On-trade (pubs, bars, restaurants)
No/lo sales have been slowly but surely increasing since 2016. However, they remain at a low level compared to all alcohol sales. At the end of 2023, no/lo drinks made up 0.8% of all alcohol sales. If the current trend continues, this is expected to reach 0.9% by the end of 2025.
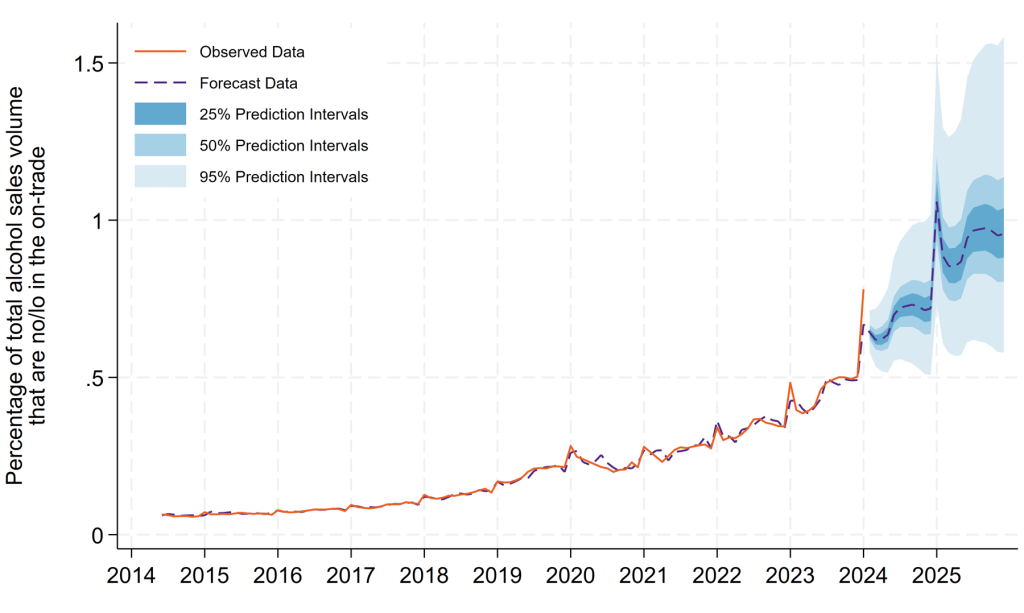
Figure 1. Percentage of total alcohol sales volume that are no/lo in the on-trade
Off-trade (shops, supermarkets)
No/lo sales tend to go up and down throughout the year, with a big increase in January and smaller increases in the summer. By the end of 2023, no/lo drinks accounted for 1.5% of all alcohol sales. This is predicted to rise to 2.3% by the end of 2025.
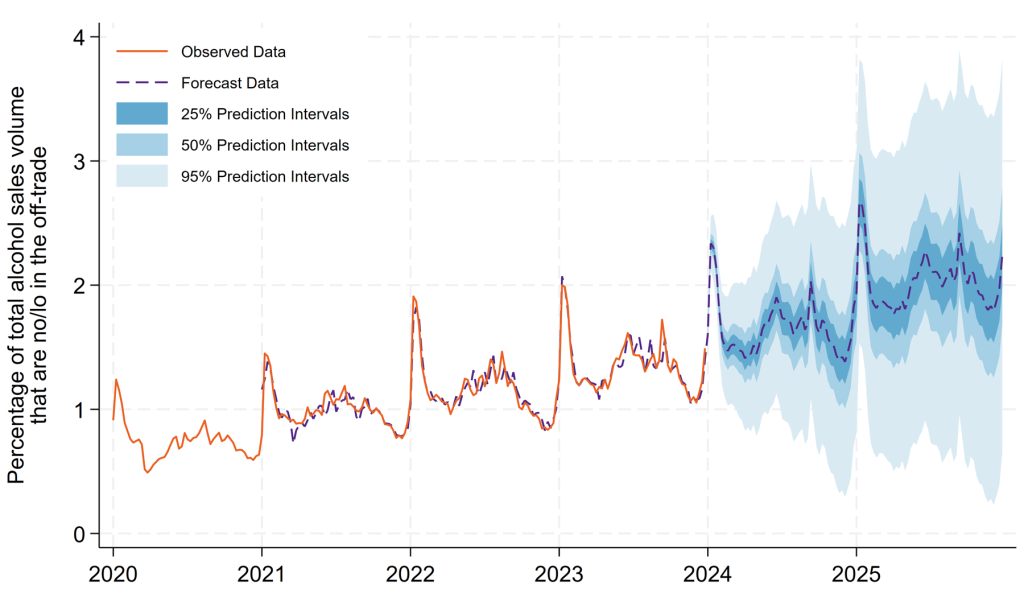
Figure 2. Percentage of total alcohol sales volume that are no/lo in the off-trade
Cutting down on alcohol
The number of increasing or higher-risk drinkers using no/lo drinks to help them cut down has been up and down, but overall, there's an upward trend. Our study predicts that by the end of 2025, 42.4% of hazardous or harmful drinkers trying to reduce their alcohol intake will have used no/lo products in their most recent attempt. So although no/lo drinks still only make up a small proportion of all alcohol sales, they are playing a big role in attempts to reduce drinking. What is less clear is whether they are making these attempts more successful, a question we are aiming to answer through our ongoing research.
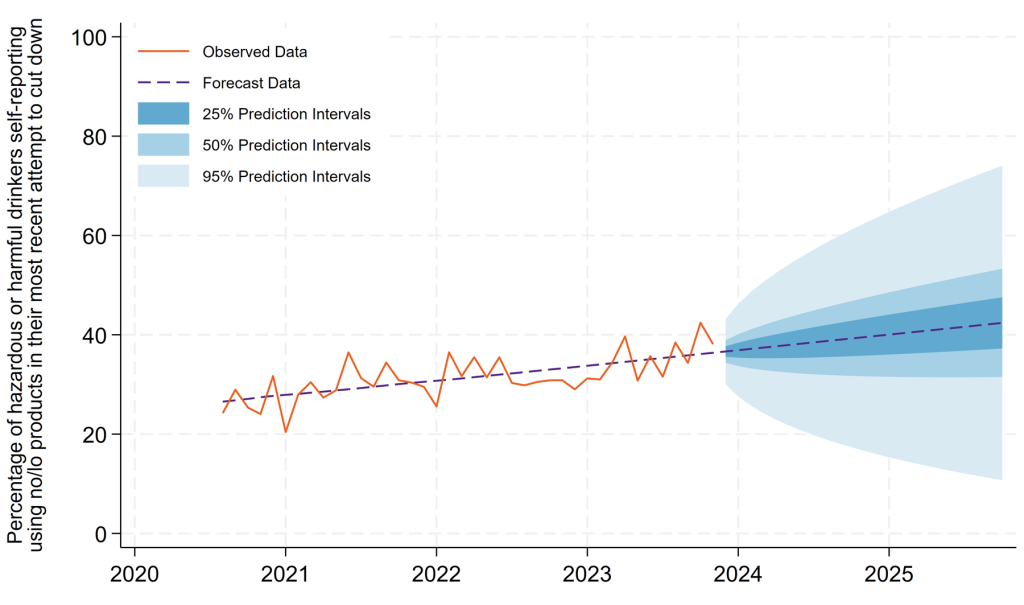
Figure 3. Percentage of increasing or higher risk drinkers self-reporting using no/lo products in their most recent attempt to cut down
Summary of findings
Overall, the study shows that no/lo drinks are becoming more popular. Sales, purchases and consumption have all increased, and this is expected to continue until the end of 2025. However, no/lo drinks still only make up a small part of the overall alcohol market. By the end of 2025, they are predicted to account for only about 1.0% of on-trade sales and 2.3% of off-trade sales.
Implications for public health
The no/lo market is growing, but the relatively low level of sales means it is unlikely to make a big difference to public health by 2025. If the government wants to use no/lo drinks as a key part of its plans to reduce alcohol harm, it might need to do more to encourage growth in this market. It may also need to look at other policy options which have been shown to reduce alcohol-related harm. Through the No/Lo Project and other research, the Sheffield Addictions Research Group is working hard to provide evidence-based insights to inform future public health strategies.
This blog post is based on the following paper, of which Luke B Wilson and Abigail K Stevely are joint first authors:
Wilson LB, Stevely AK, Kersbergen I, McGrane E, Moore EC, Pryce RE, Brown J, Holmes J (2025) Current and future trends in the consumption, sale and purchasing of alcohol-free and low-alcohol products in Great Britain, 2014 to 2023 Addiction DOI: https://doi.org/10.1111/add.70041