
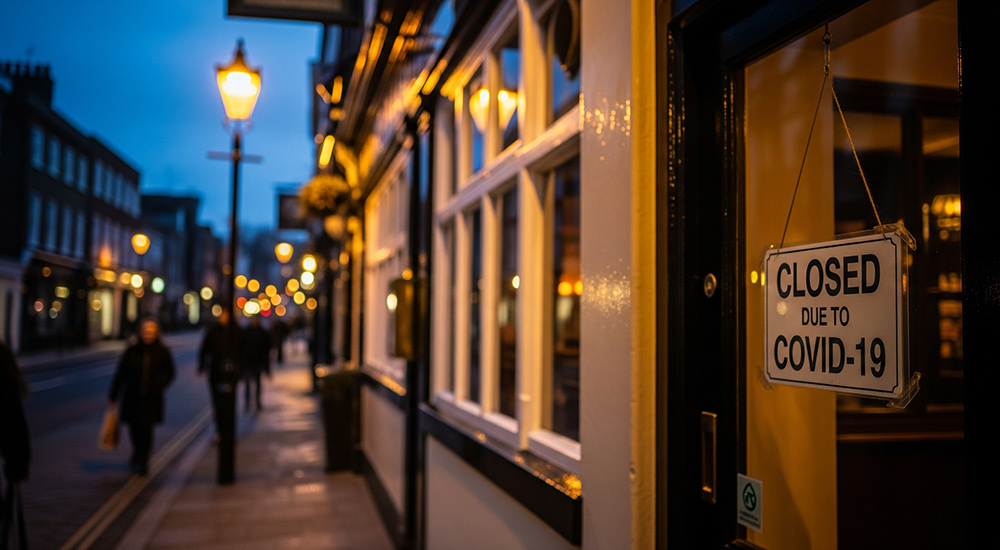
There are lots of reasons why alcohol consumption in the UK might have changed since the start of 2020. The COVID-19 pandemic and associated restrictions dramatically changed many aspects of our lives, including closing pubs and turning almost all socialising into a strictly online activity for months on end.
After the final restrictions were lifted and life began to return to something resembling normality, a combination of the economic hangover of the pandemic, Russia's invasion of Ukraine and wider global political and economic instability led to rapidly rising prices for energy and many household goods.
This 'cost-of-living crisis' squeezed household budgets while increasing the price of alcohol, but also increased stress levels for many people, potentially leading to an increase in drinking to cope. On top of all of this, in August 2023, the Government also implemented reforms to the way that alcohol is taxed and increased taxes in line with inflation, which given the high rates of inflation at the time reflected the biggest single increase in alcohol duties for at least 40 years.
Challenges in measuring alcohol consumption
With all of this going on, understanding how people's drinking has changed in response to this relentless barrage of stuff is an important public health question. But this is easier said than done.
Our main source of data on alcohol consumption is from large-scale surveys that ask people about their drinking, but figures from these are often only published several years after the data has been collected. Worse, the way that some of this data is collected changed during the pandemic – from in-person interviews to telephone or online. We know that the answers that people give about their drinking can be very sensitive to how the questions are asked, so we have to be very careful about comparing this most recent data with pre-pandemic figures.
In the face of some of these challenges, I began exploring alternative sources of data, including figures that the UK government publishes about the amount of revenue that they receive from alcohol duty every month (known as 'duty receipts'). Together with my colleague Jonas Schöley, our analysis of this data and what it can tell us about recent trends in alcohol consumption have now been published in a new study in the journal Addiction. We think the findings offer some really interesting, and at times, unexpected insights into the nation's drinking habits.
This work was conducted as part of our ongoing NIHR-funded project, 'Reforming alcohol taxes in a cost-of-living crisis', which is evaluating the impact of alcohol tax changes and economic pressures on consumption and harms.
Our approach: Looking at alcohol duty like 'excess deaths'
To understand these trends, Jonas and I took an approach that many of you will have become (sadly) familiar with over the past few years – using the methods typically used to estimate 'excess deaths' and applying these to instead estimate 'excess duty revenue'.
Simply – we used data from before the pandemic to model what we would have expected trends in monthly alcohol duty revenue to look like if the pandemic (and everything else since) had never happened, and compared this forecast to the actual monthly duty receipts.
Of course, we are looking here at duty revenue, not actual alcohol sales, but we believe that the two are very closely linked, as most alcohol (indeed, all alcohol since August 2023) is taxed on the basis of its alcohol content. As a result, trends in duty revenue can give us a clear indicator of what trends in alcohol consumption have looked like.
The pandemic years (2020-21): A complex picture
What we found for 2020 and 2021 was surprising, even to me, as someone who has spent altogether too much time trying to work out what happened to our drinking during COVID restrictions. News stories from April 2020 were filled with images of bare supermarket alcohol aisles and hand-wringing about how this showed that we were all trying to drink away the trauma of lockdown.
The scientific evidence is more nuanced, with multiple studies across many high income countries finding a 'polarisation' of drinking, with heavier drinkers drinking more and lighter drinkers having cut down, or even given up alcohol altogether.
In the face of this evidence, it was therefore unexpected to find that our analysis of alcohol duty data showed a sharp fall in duty receipts (relative to the pre-pandemic trend) in March and April 2020, followed by a corresponding increase once restrictions were relaxed in the summer, as shown in the graph below.
This suggests that overall we drank less during lockdowns, but compensated for this by drinking more than usual once we were allowed to socialise in person again. This same pattern was repeated, with a fall in receipts when COVID measures were reintroduced at Christmas 2020 and for the first few months of 2021, followed by a rebound once they were lifted again.
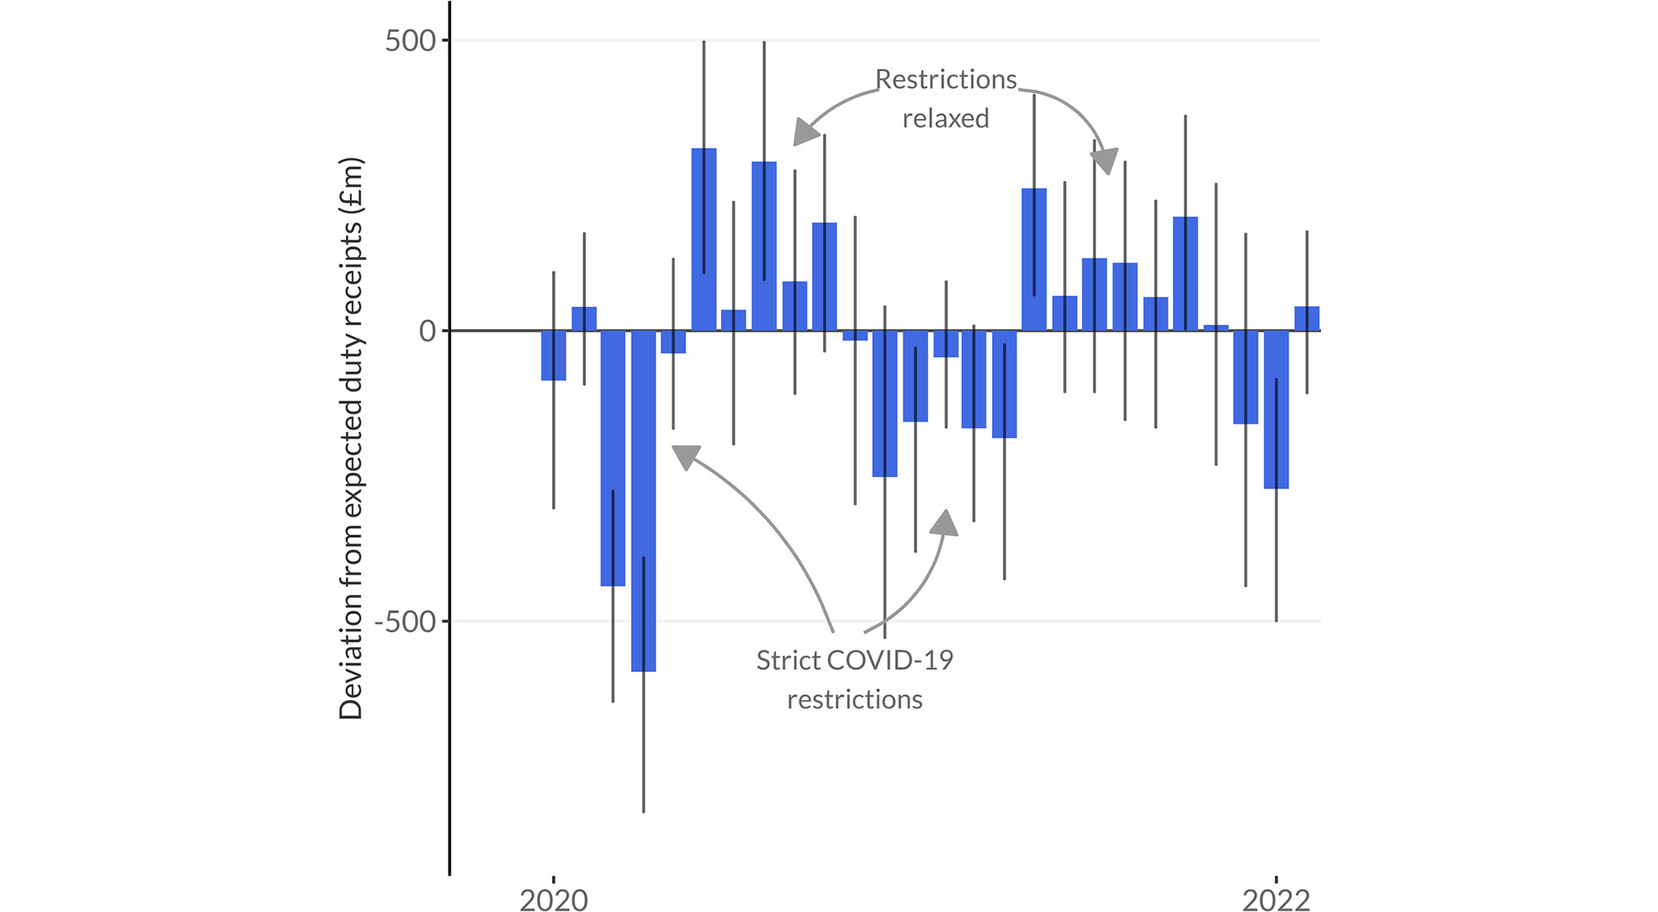
This graph shows the monthly 'excess revenue' from alcohol duty compared to our pre-pandemic trend. Above the line indicates higher sales than expected, below the line indicates lower.
Now, you might think, "Well, of course we drank less during lockdown – the pubs were all shut!" And that's part of the story. But evidence from the UK has clearly shown, using survey data from April 2020, that the number of people reporting drinking heavily increased compared to immediately before the pandemic. So how can we square this with an overall fall in drinking?
The best explanation seems to be that the polarisation of drinking that we've seen reported elsewhere was even more severe than we'd previously understood. The overall level of alcohol sales appears to have been dampened by widespread reductions in consumption among moderate drinkers, masking significant increases among those already drinking heavily.
Overall, the net impact of these fluctuations was close to zero. Across 2020 and 2021 we estimate that we drank almost exactly as much as we would have if they had been 'normal' years, it's just that this conceals significant variation, both in when during the year we were drinking more or less and also in how much people were drinking at the individual level, with some people drinking less and others a lot more.
Post-pandemic (2022 onwards): A consistent downturn
The trends since the start of 2022 are equally interesting, but in a different way. We find that since the start of 2022, alcohol sales have been consistently below the pre-pandemic trend. This decline began with a small deficit in early 2022 and then increased sharply around October/November 2022 and has remained at more or less the same level ever since (our analysis goes up to January 2025).
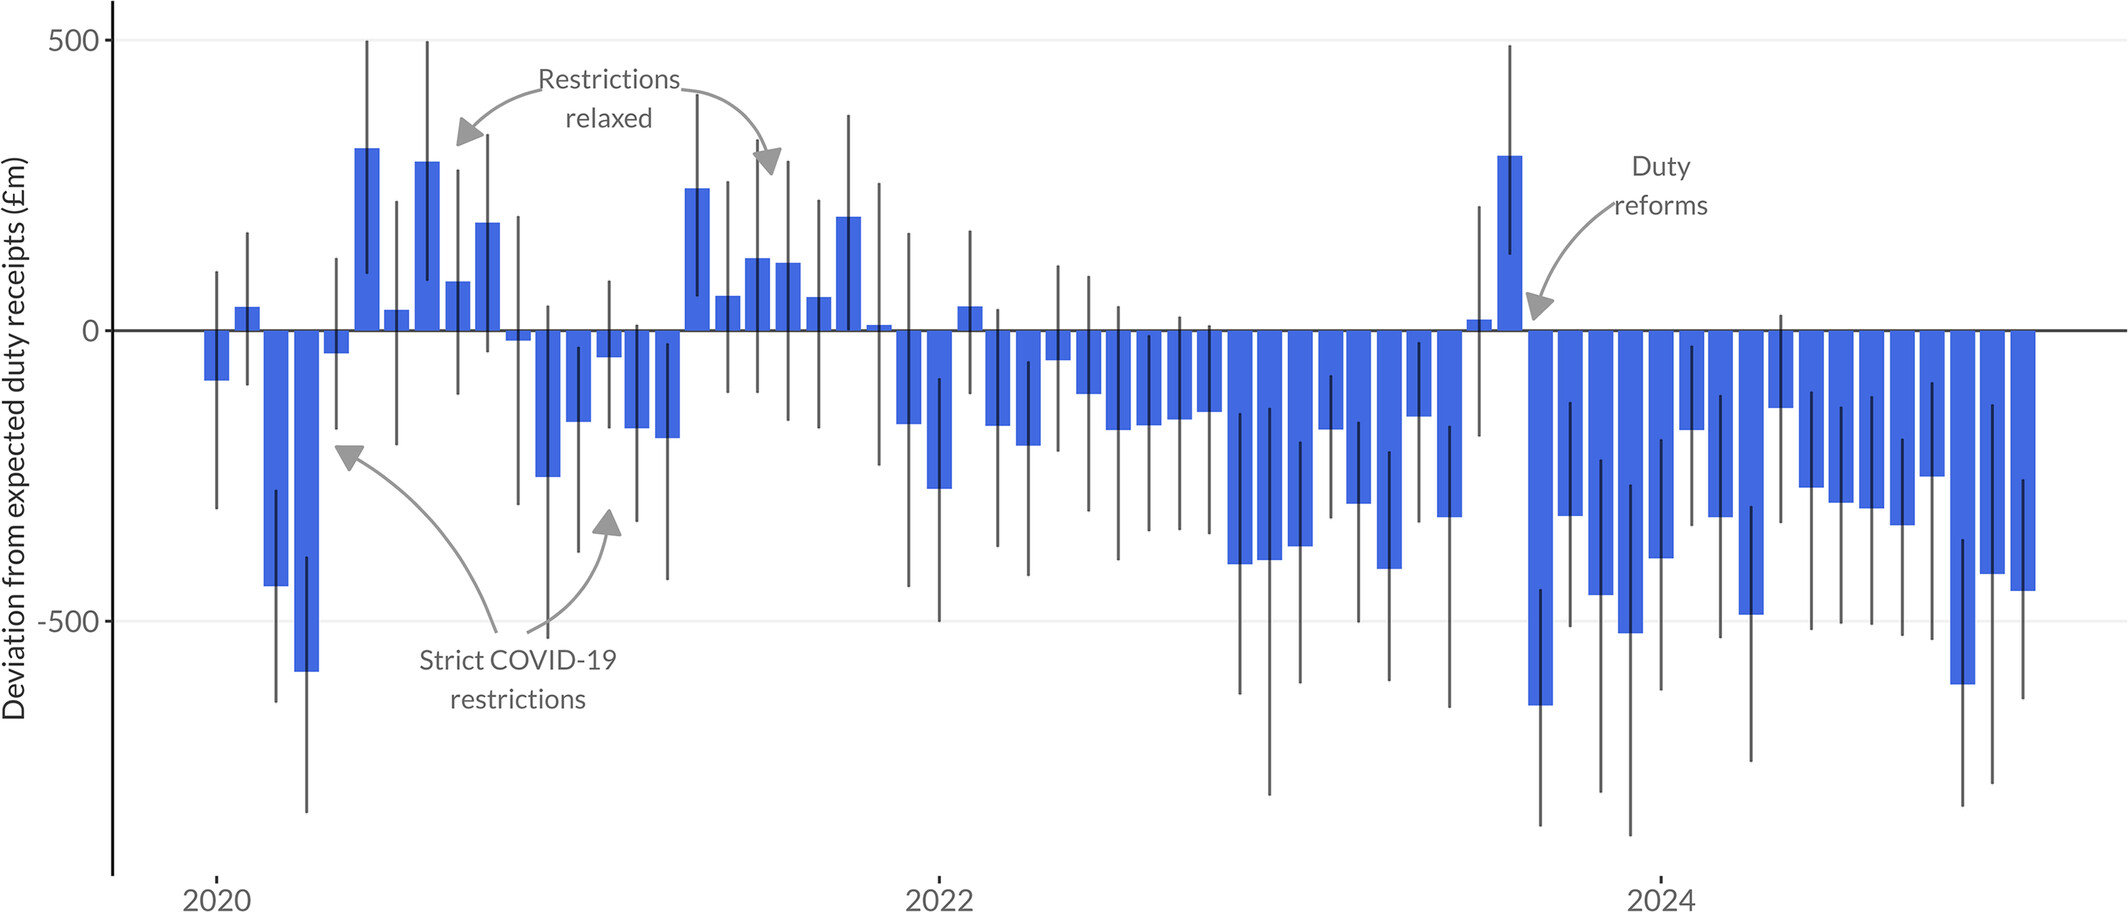
This graph shows the monthly 'excess revenue' from alcohol duty compared to our pre-pandemic trend. Above the line indicates higher sales than expected, below the line indicates lower.
What could explain this? Inflation rates started to rise in late 2021, passed 5% for the first time in February 2022 and peaked in October 2022 at almost 10%. So it looks a lot like the emerging cost-of-living crisis and associated financial pressures have led to more of us tightening our belts and buying less alcohol as a consequence.
But that sharp fall in duty revenue in the autumn of 2022 is a bit harder to explain. Although it corresponds with the month in which inflation rates were at their highest, this was the culmination of a gradual rise, not a sudden peak. It does line up with the short-lived premiership of Liz Truss – perhaps the sudden economic instability of her brief reign put us all off our drink?
One final notable feature of this graph is the clear 'blip' in August 2023, the month in which alcohol duties were reformed. This clearly reflects something known as 'forestalling' – the process where alcohol producers choose to pay tax on more alcohol than usual because they know an increase is coming. It's a temporary spike, and overall, the net effect of the duty reforms on the wider trend appears pretty negligible. Our analysis shows that the fall in duty receipts had clearly predated the reforms (in spite of claims to the contrary by many in the alcohol industry).
To illustrate this cumulative impact, here's how the total 'excess' duty revenue has stacked up since January 2020. Over the following five years we estimate that the Treasury has lost £10.3bn compared to what we would have expected if the historical trend had continued. This equates to a 12.3% fall in revenue from alcohol duties over this period.
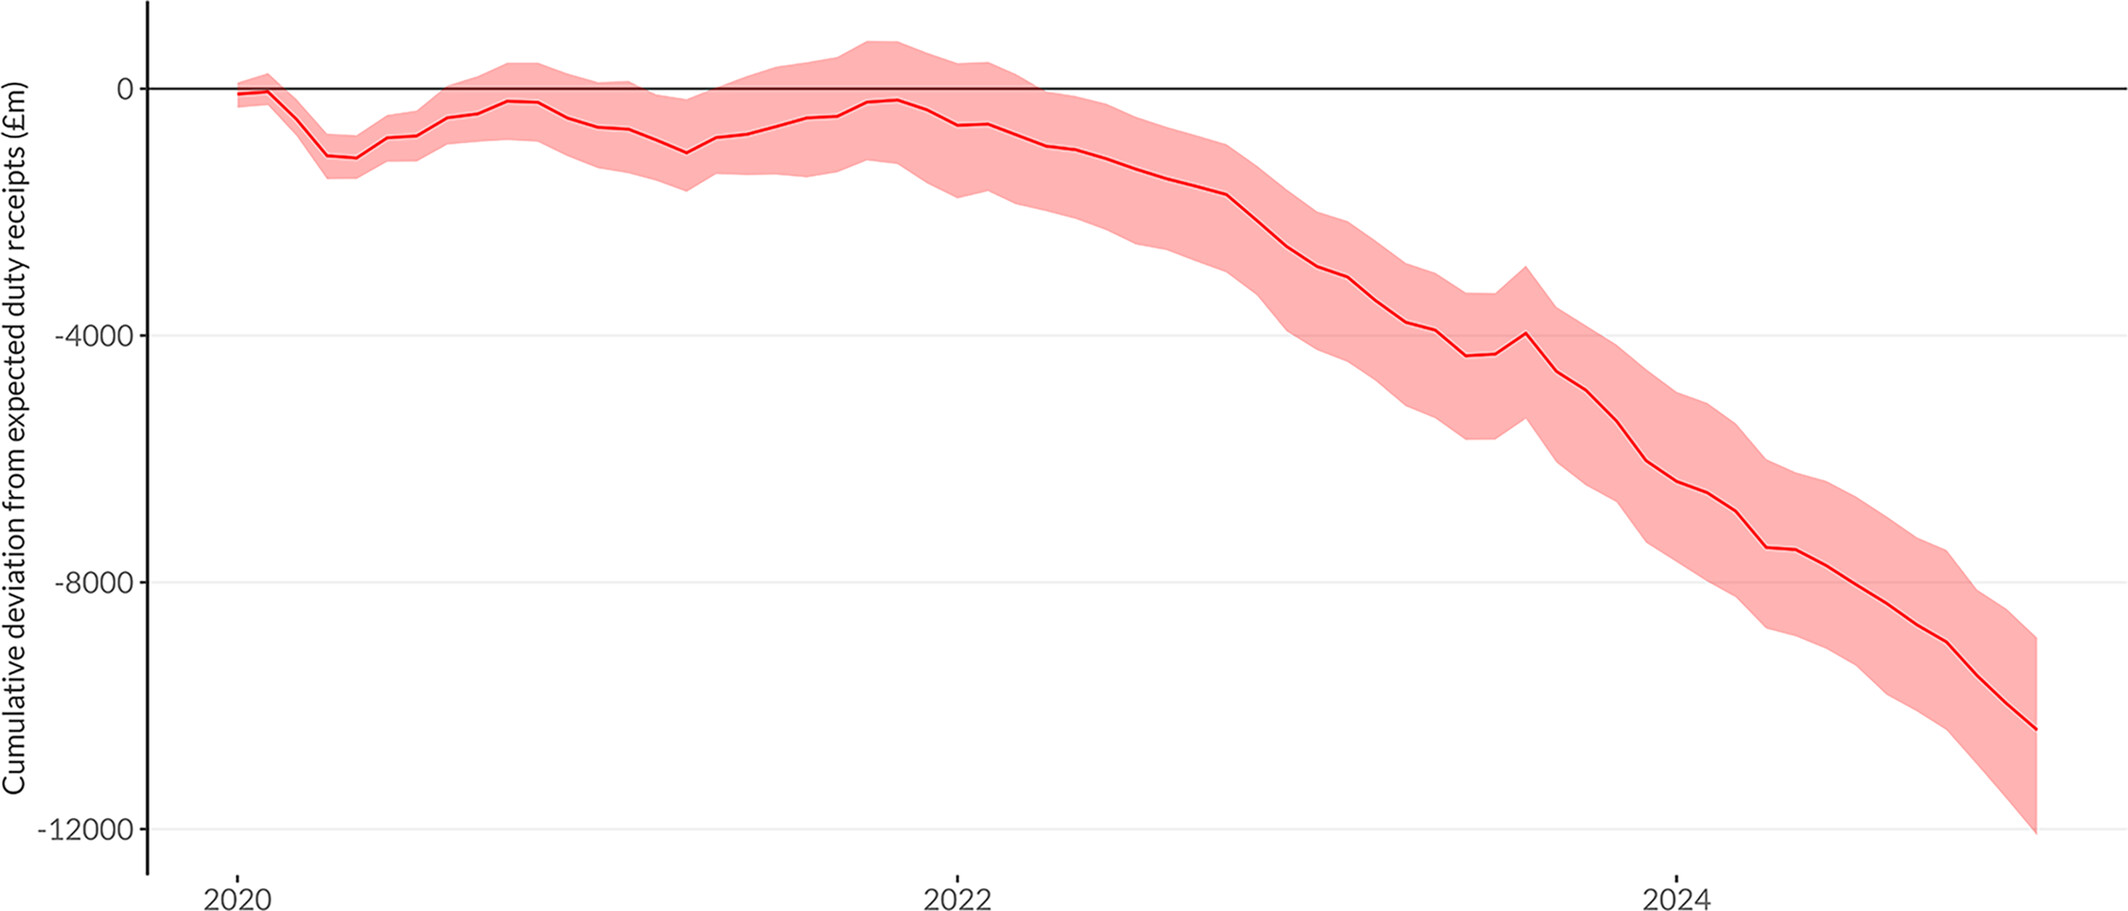
This graph shows the cumulative deviation in alcohol duty revenue from our pre-pandemic trend since January 2020. A downward trend indicates a cumulative shortfall.
Decomposing sales by beverage type: More surprises
One additional interesting feature of the alcohol duty data that we've used in this analysis is that the figures are reported separately by type of alcohol – beer, cider, spirits and wine. Forecasting the component parts of a time series while also making sure that the combined forecast makes sense is a surprisingly challenging problem, but luckily my coauthor Jonas has developed some clever statistical methods that allow us to do exactly that. This lets us look at excess revenue separately for each type of alcohol, which reveals some interesting additional patterns hiding behind the overall trends we've already discussed.
The biggest falls during COVID restrictions, particularly the first lockdown, can be seen in beer. This isn't a surprise, as we drink a lot of beer in pubs – more than one billion pints per year – so pub closures clearly had an impact. However, the subsequent increases as restrictions were lifted came from both beer and spirits. The increase in beer makes sense – people returning to pubs as they reopened – but the increase in spirits is surprising and defies simple explanation.
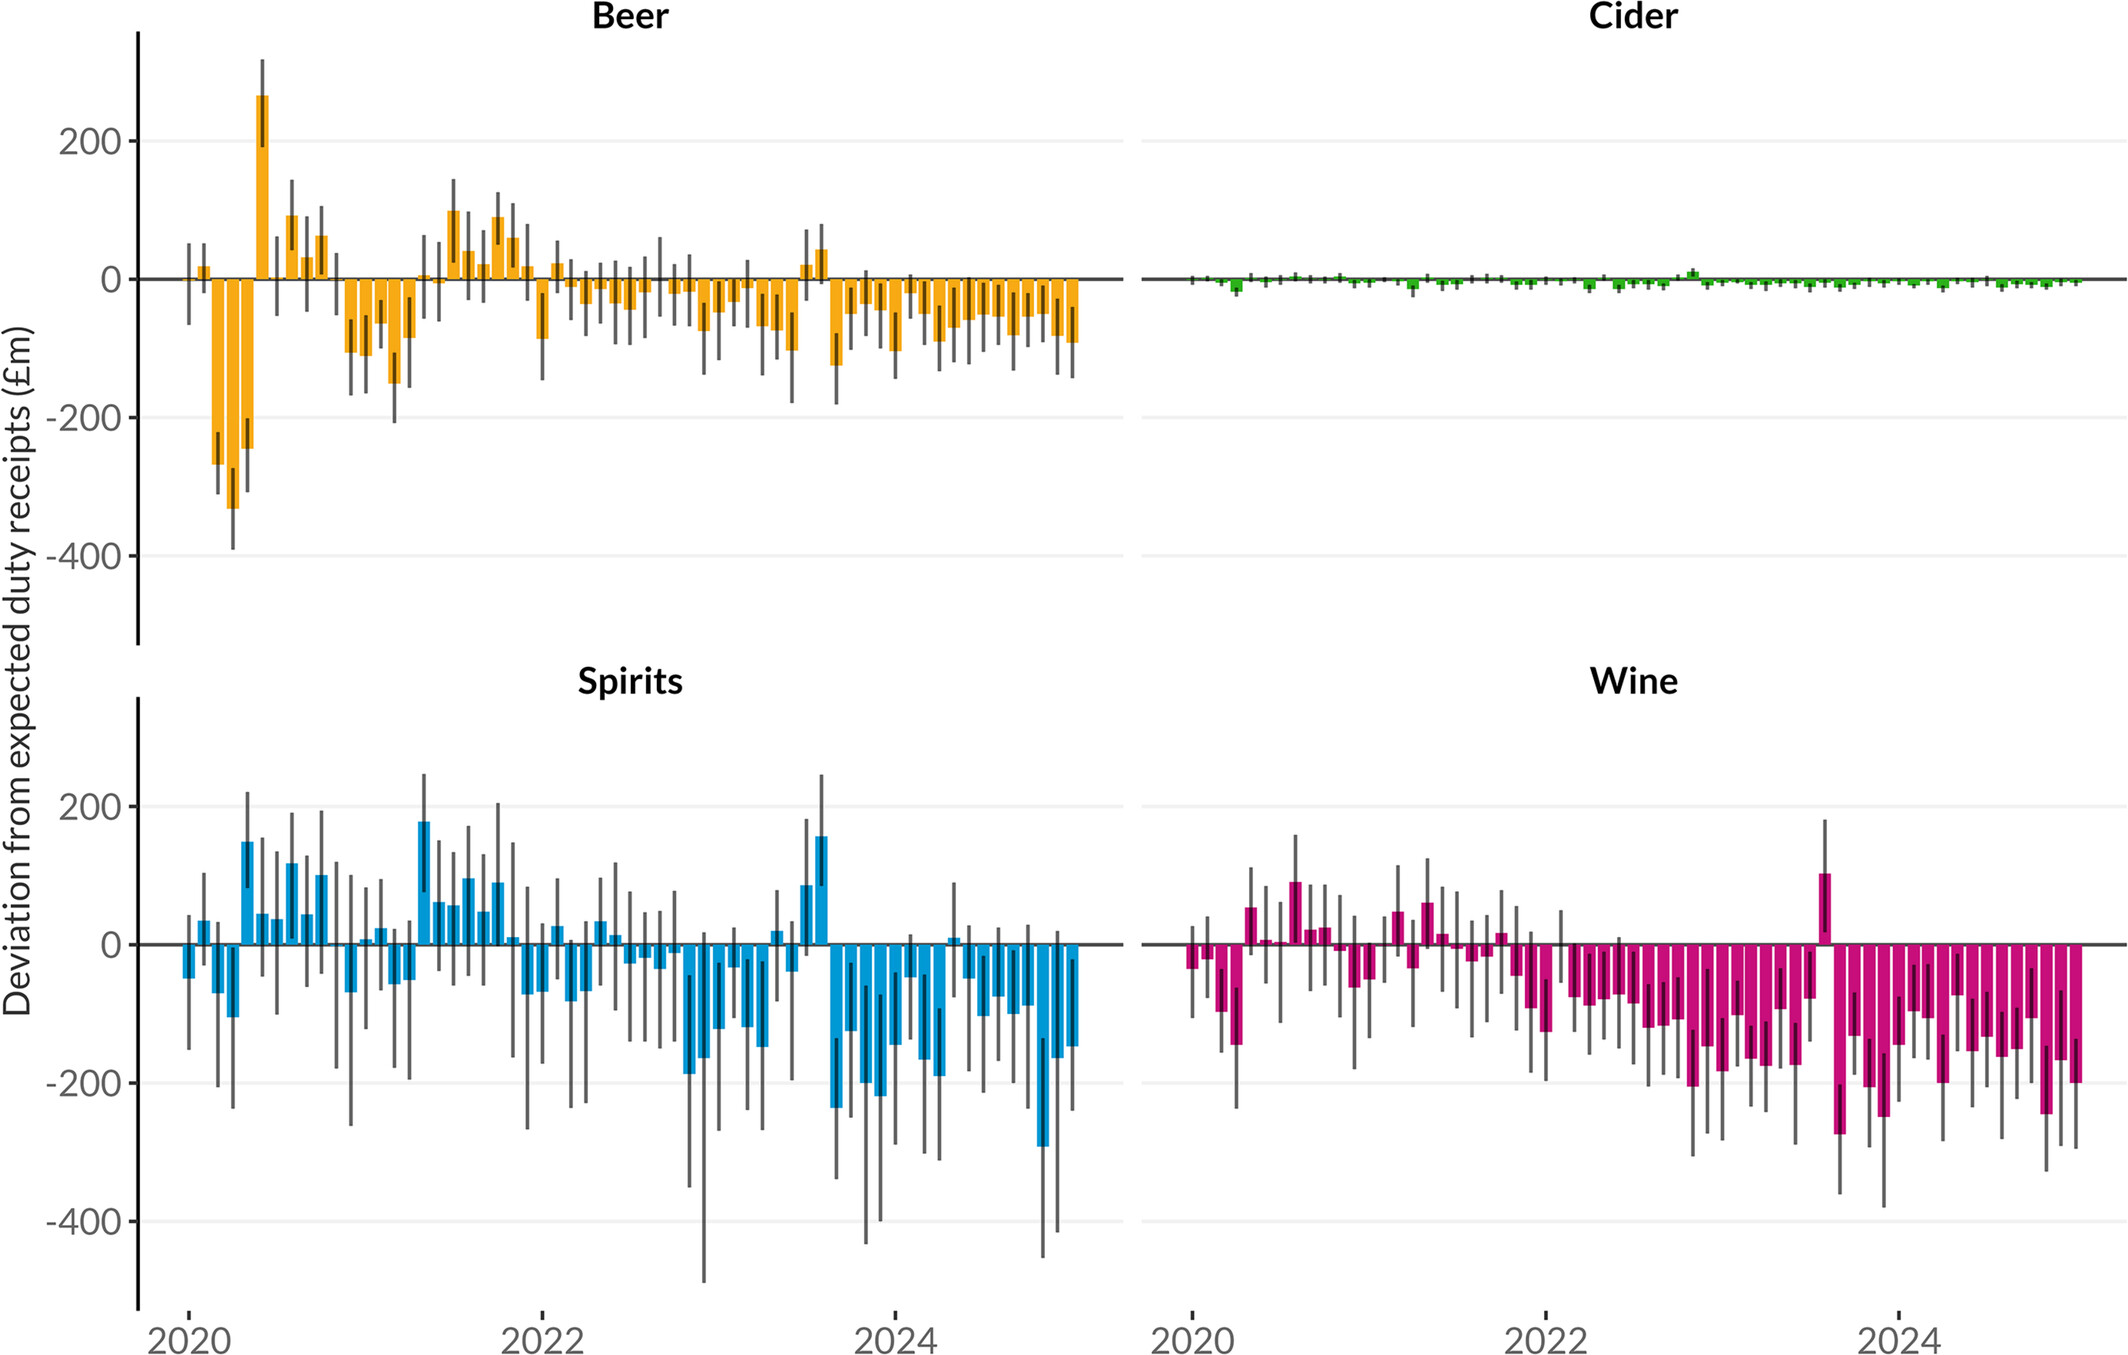
This graph illustrates the monthly 'excess revenue' for beer, wine, and spirits individually, showing how sales trends for each alcohol type deviated from pre-pandemic expectations.
More intriguingly, the fall in duty receipts that began in early 2022 was much clearer in wine. This was surprising, because if it genuinely reflected people tightening their belts during the cost-of-living crisis, you'd typically expect to see a stronger effect in beer and spirits, which are more widely consumed by lower-income groups who have borne the brunt of high inflation. Wine, on the other hand, is disproportionately consumed by higher-income groups.
Then, whatever happened while Liz Truss was in charge had the biggest impact on spirits revenue. You can see this clearly when you plot the cumulative deviation by type. After remaining above the pre-pandemic trend up until autumn 2022, spirits saw a sharp downturn at this point. It's also interesting to see quite how much greater the overall shortfall in revenue from wine sales since 2020 is compared to beer and spirits.
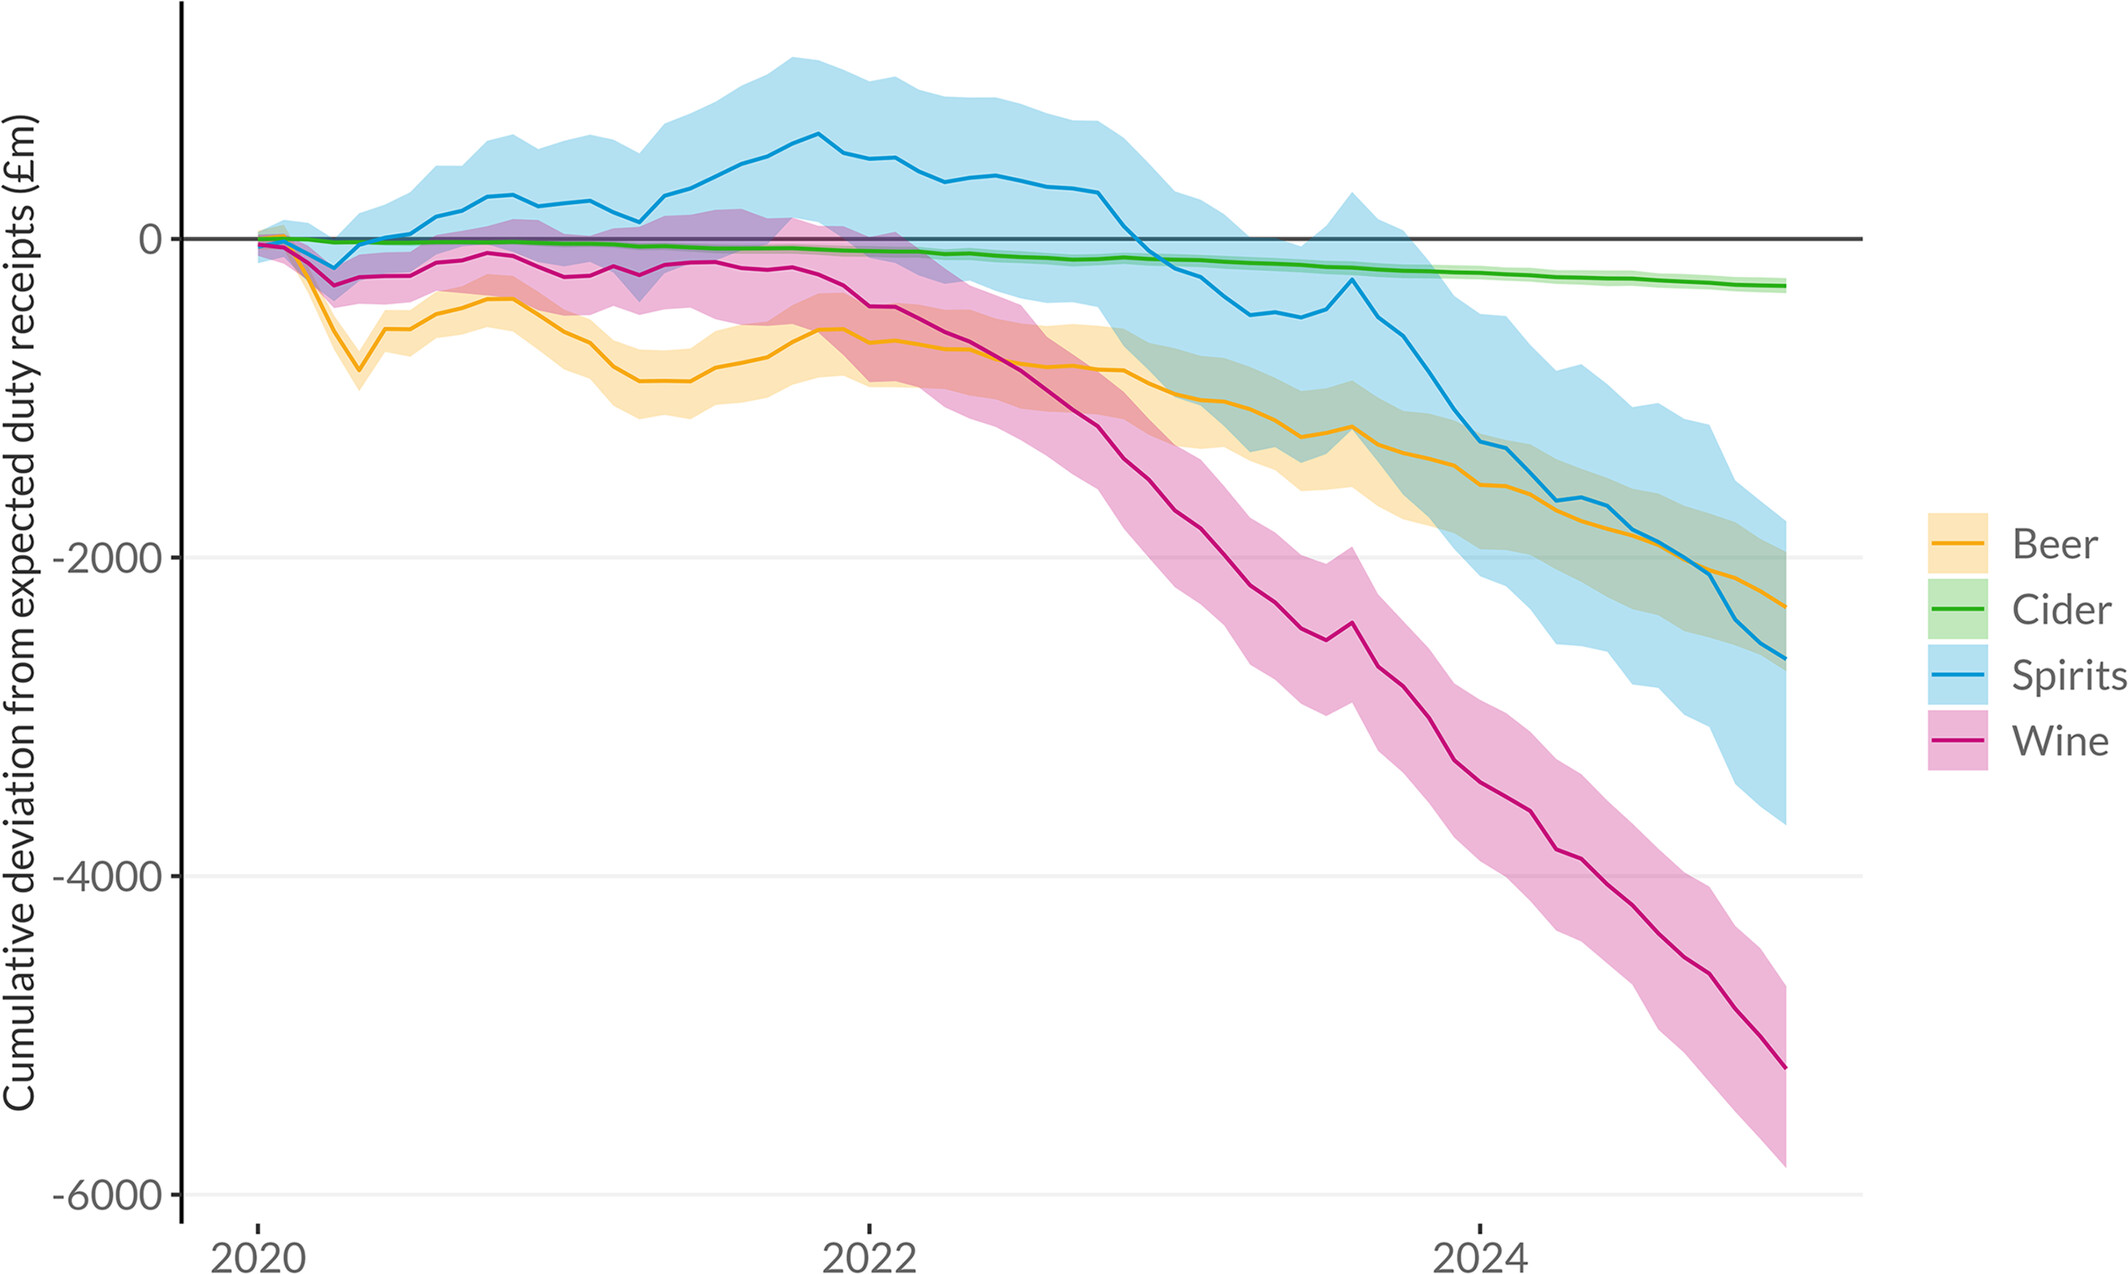
This graph presents the cumulative deviation in alcohol duty revenue for beer, wine, and spirits since January 2020, revealing the overall shortfall experienced by each category.
Is this good news?
Our study strongly suggests that as a nation, we are drinking less alcohol than we were in 2019. Which is good news from a public health perspective. So, is it time to (responsibly) crack out the champagne? Well, in a word, no. In stark contrast to our findings about alcohol sales, we have seen alcohol harms rise alarmingly during the pandemic.
The most concerning figures are the number of people dying from 'alcohol-specific causes', which are conditions that are caused only by alcohol, most notably alcohol-related liver disease. These have risen by a staggering 42.2% since 2019 to reach their highest levels on record in 2023.
How can alcohol sales be falling while deaths caused by alcohol are rising? We don't have a comprehensive answer to this, but a significant part of the puzzle almost certainly lies in the polarisation of drinking discussed earlier.
Emerging evidence suggests that although survey data shows that the initial increase in rates of heavier drinking in early 2020 have started to fall back to pre-pandemic levels, this return is slowest in older age groups, lower socioeconomic groups and the heaviest drinkers. These are exactly the people that suffer the greatest burden of alcohol harms. So it appears that the longest-lingering impacts of the pandemic on our drinking behaviours are in exactly these, most vulnerable groups.
It also seems likely that there is more than this going on. In a previous study, my colleagues and I modelled the expected health impacts of the polarisation in drinking in 2020, under various more or less pessimistic assumptions about how this polarisation might evolve in the following years. The graph below shows how our estimates (the lines) compare to reality (the dots):
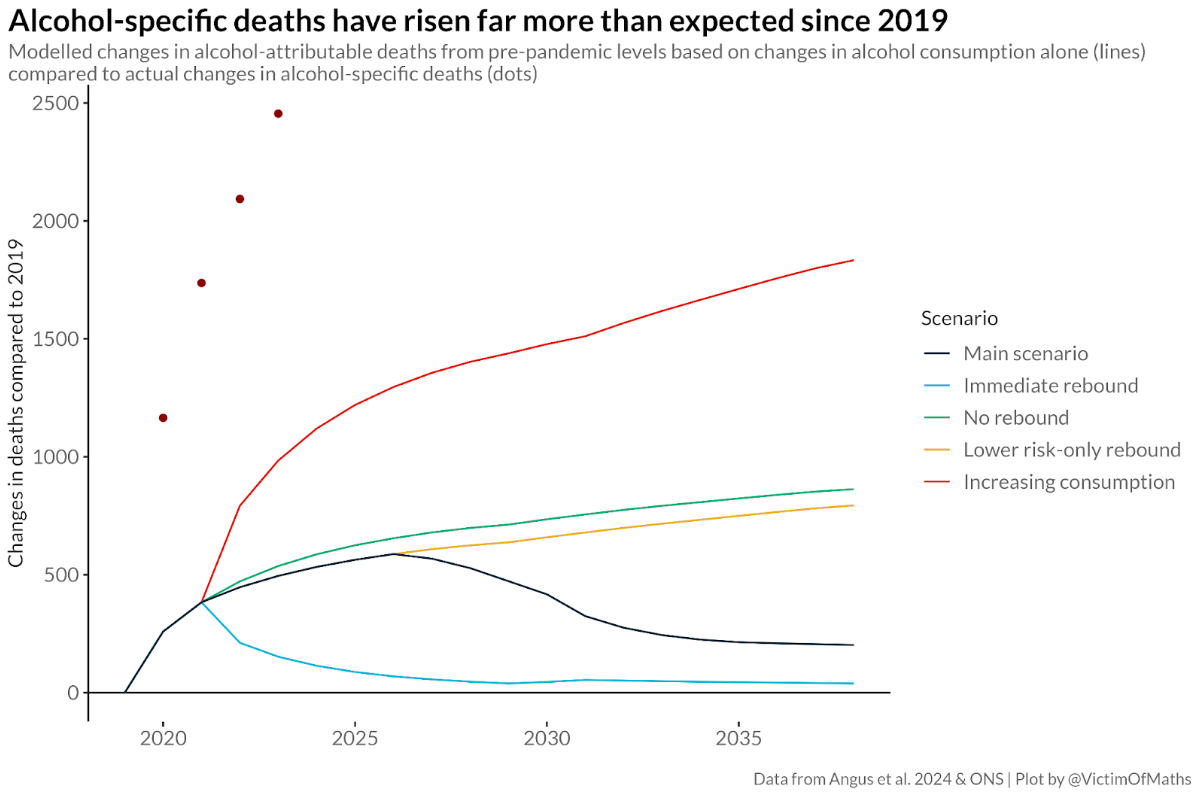
This graph shows modelled changes in alcohol-attributable deaths from pre-pandemic levels based on changes in alcohol consumption alone (lines) compared to actual changes in alcohol-specific deaths (dots)
This strongly suggests that there is some other factor or factors contributing to the recent increase in alcohol deaths. Whether that is related to the ways that the heaviest drinkers engage (or not) with specialist alcohol treatment services, the pandemic having changed the way that people engage (or not) with healthcare services, the cumulative effects of multiple severe economic challenges on psychological distress, some combination of these or something else, remains a critical, but unanswered question.
Implications for UK alcohol policy
This research highlights two crucial questions for UK alcohol policy:
- How can we identify the potentially significant group of people who started drinking more in 2020 and may well have kept on drinking heavily since then, and what can we do to help them?
- What else is driving increases in alcohol deaths and what can we do to address these issues?
Understanding these complex, shifting patterns of consumption and harm is essential if we are to implement effective policies to reduce alcohol-related harm across the population.